@Paul said:
Performance meter is always in real-time, while the Activity Monitor takes an average value.
I would say that something is wrong, either the design or the implementation. If your meter constantly shows 10% and the Task Manager constantly shows 2%, there can't be a difference just based on real time vs average value. And even if all numbers actually are correct - in what way does your 10% value give me any usable information for a process that have an average load of 2% on my system?
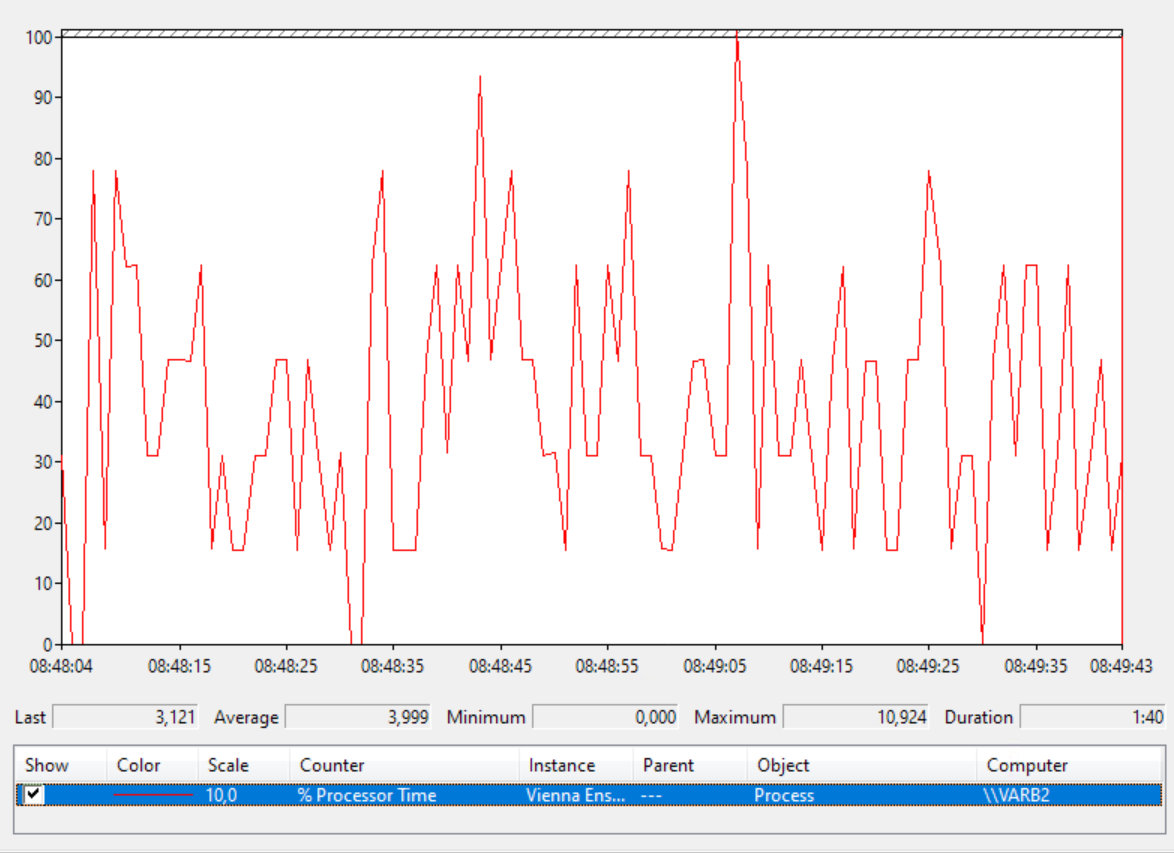
I have measured the CPU load for the VEP process over time and have attached the graph. During this period (1.5 minute) my impression from the performance meter in VEP was that there were about 10% constant load. According to the performance monitor, the CPU load from the VEP process averaged around 4% (the scale is x10 in the graph) and only once managed to get above 10%.
The thing I'm getting at here is that even if the numbers technically would be correct (which I honestly doubt), the implementation gives me the wrong impression. As I said - during this period when I measured the CPU load using Performance Monitor, my impression from the CPU meter in VEP was that there were a pretty stable load of about 10%.
Maybe having a CPU meter going all over the place in real time isn't the best way to give the user a usable estimation of the CPU load?